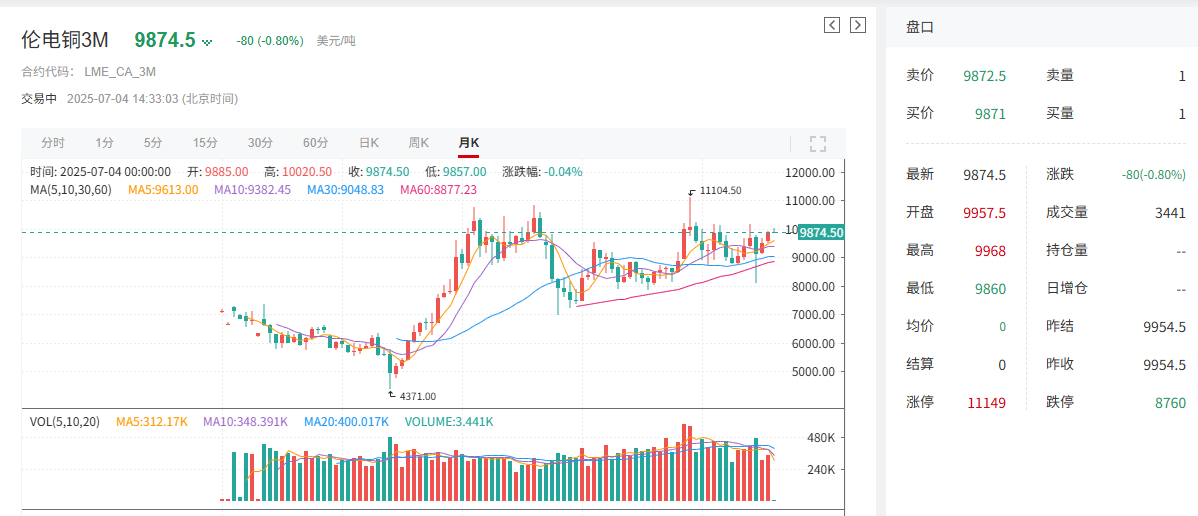
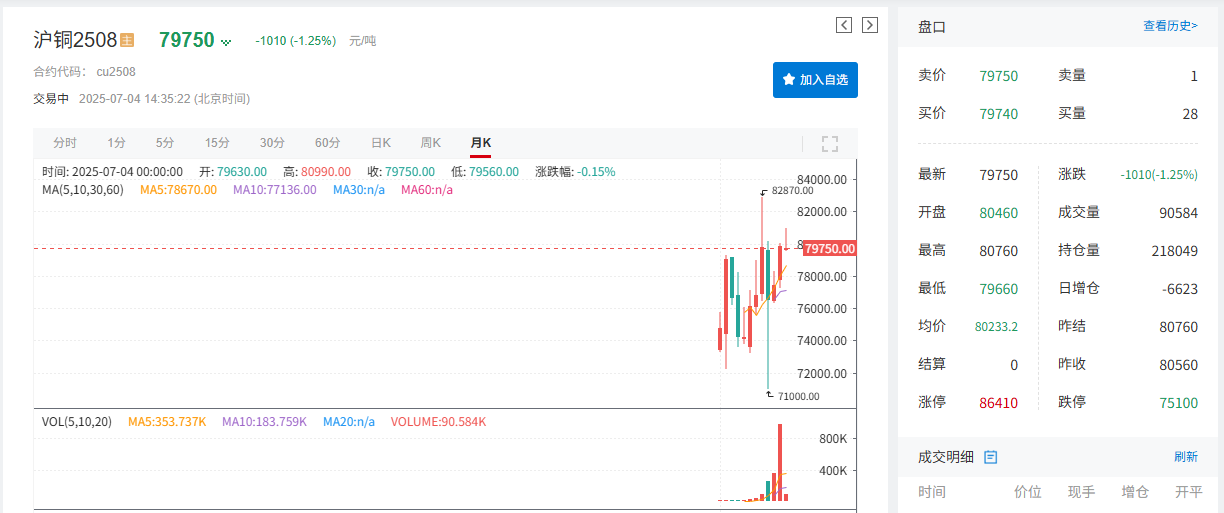
Editor's Note: Driven by multiple factors such as the decline in global copper mine output growth, tightening supply of copper concentrates, and rising expectations for production cuts among smelters, coupled with sustained growth in demand for copper from sectors like new energy vehicles (NEVs) and power grid investments, highlighting the resilience of demand, as well as market concerns triggered by the US's proposed tariff hike on imported copper, which has spurred stockpiling, and the intensification of geopolitical conflicts in places like the Democratic Republic of the Congo (DRC), copper prices ultimately concluded the first half of the year with gains—LME copper saw a 12.66% increase over the six-month period, SHFE copper rose by 8.22%, and SMM #1 copper cathode recorded a cumulative gain of 8.4% in the first half. Now, as the second half unfolds, whether these factors that drove copper prices higher in the first half will continue to play a role has become a focal point of market attention! Whether copper prices can sustain the upward momentum seen in the first half remains to be seen over time.
》Click to view SMM Futures Data Dashboard
Spot Market
Copper cathode prices rose by 8.4% in the first half of the year, with a 4% YoY increase in the daily average price for the semester
》Click to view SMM spot copper prices
》Subscribe to view SMM historical spot metal price trends
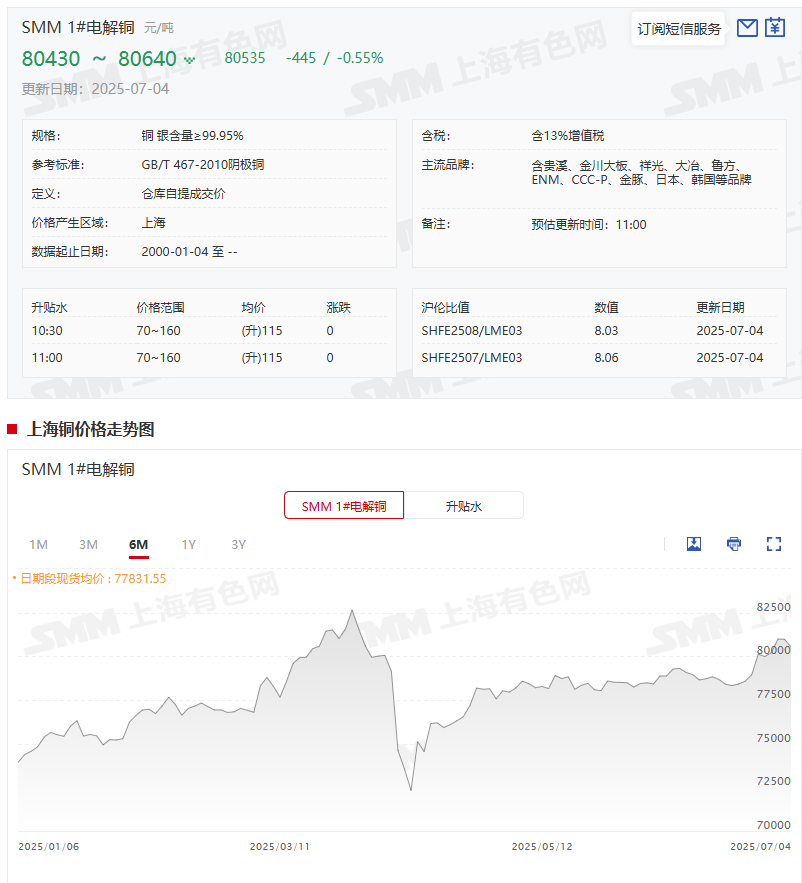
Spot Prices:According to SMM quotes, the average price of SMM #1 copper cathode was 73,790 yuan/mt on December 31, 2024, and 79,990 yuan/mt on June 30, 2025, marking an increase of 6,200 yuan/mt in the first half, or an 8.4% gain. Since entering July 2025, SMM #1 copper cathode prices have fluctuated, with the overall average price center experiencing a slight upward shift. On July 4, the average price was 80,535 yuan/mt, up 545 yuan/mt from the 79,990 yuan/mt average on June 30, representing a 0.68% increase.
In terms of the daily average price for the semester, SMM #1 copper cathode averaged 77,657.65 yuan/mt in the first half of the year, compared to 74,552.86 yuan/mt in the first half of 2024, marking an increase of 3,104.79 yuan/mt, or a 4% gain.
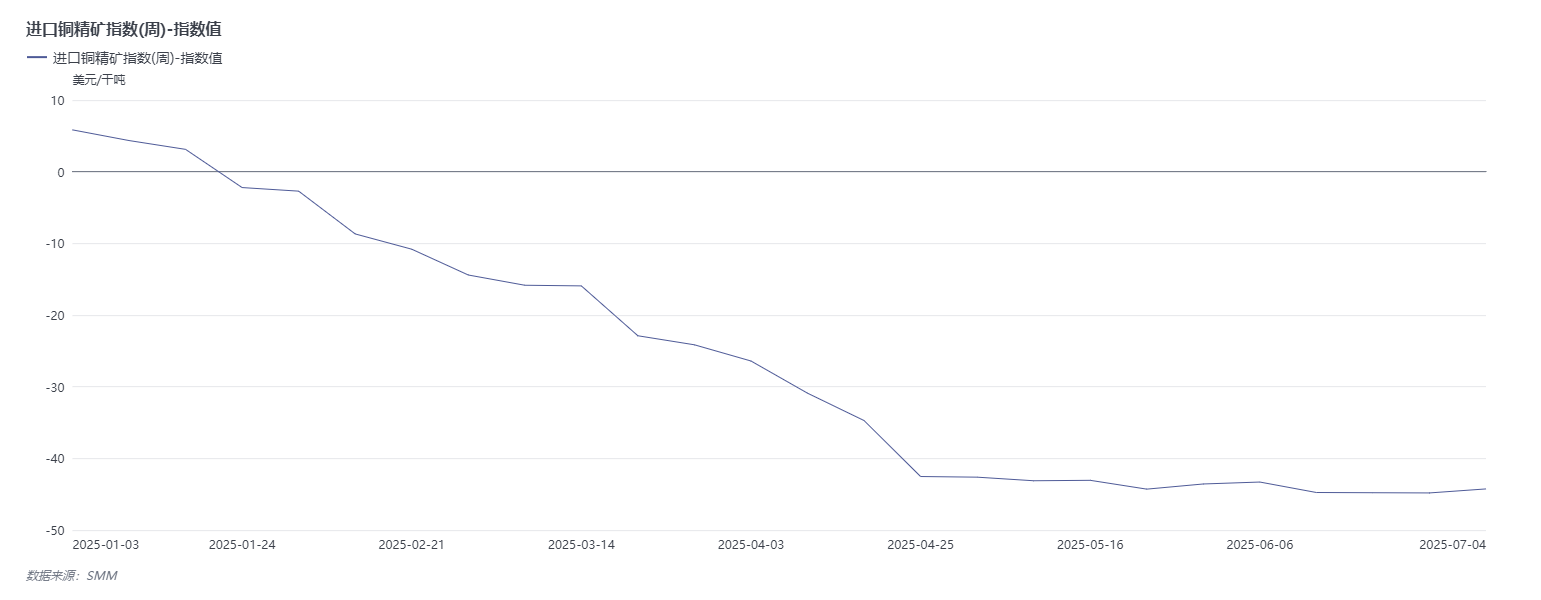
The SMM Imported Copper Concentrate Index (weekly) showed an overall downward trend in the first half of the year
》Click to view SMM Metal Industry Chain Data Terminal
Looking back at the first half of the year, the trend of the SMM Imported Copper Concentrate Index (weekly) was closely linked to market concerns about the shortage of copper concentrate supply, showing an overall downward trend. In the week of January 3, the index stood at $5.85/mt; by the week of June 27, it had fallen to -$44.81/mt, a cumulative decrease of $50.66/mt over six months, which visually reflects the ongoing intensification of the tight supply situation for copper concentrates. However, recently, the index has shown signs of stabilizing and rebounding. As of the week of July 4, the SMM Imported Copper Concentrate Index (weekly) was -$44.25/mt, up $0.56/mt from the previous week.
From an industry perspective, as previously understood by SMM, the negotiation results for TC/RC between Antofagasta and Chinese smelters for the mid-2025 period were finalised at $0.0/dmt and 0.0¢/lb.
In the first half of this year, domestic copper cathode production increased by 674,700 mt YoY, up 11.4% YoY.
Production:With half of 2025 already passed, domestic copper cathode production has reached new heights. According to SMM statistics, the cumulative production of copper cathode from January to June 2025 increased by 674,700 mt YoY, with a growth rate of 11.40%, demonstrating a strong growth momentum. So, why has there been such an explosive increase in domestic copper cathode production in the first half of this year? This is closely related to the release of domestic smelting capacity. Since the second half of 2024, new smelters have been continuously put into operation in China, and most of this new capacity was concentrated in the fourth quarter of last year and the first quarter of this year. After entering the first half of this year, the capacity utilization rates of these newly commissioned enterprises have been continuously improving, with some even reaching full production capacity. The release of a large amount of new capacity has directly driven the continuous increase in domestic copper cathode production.》Click to view details
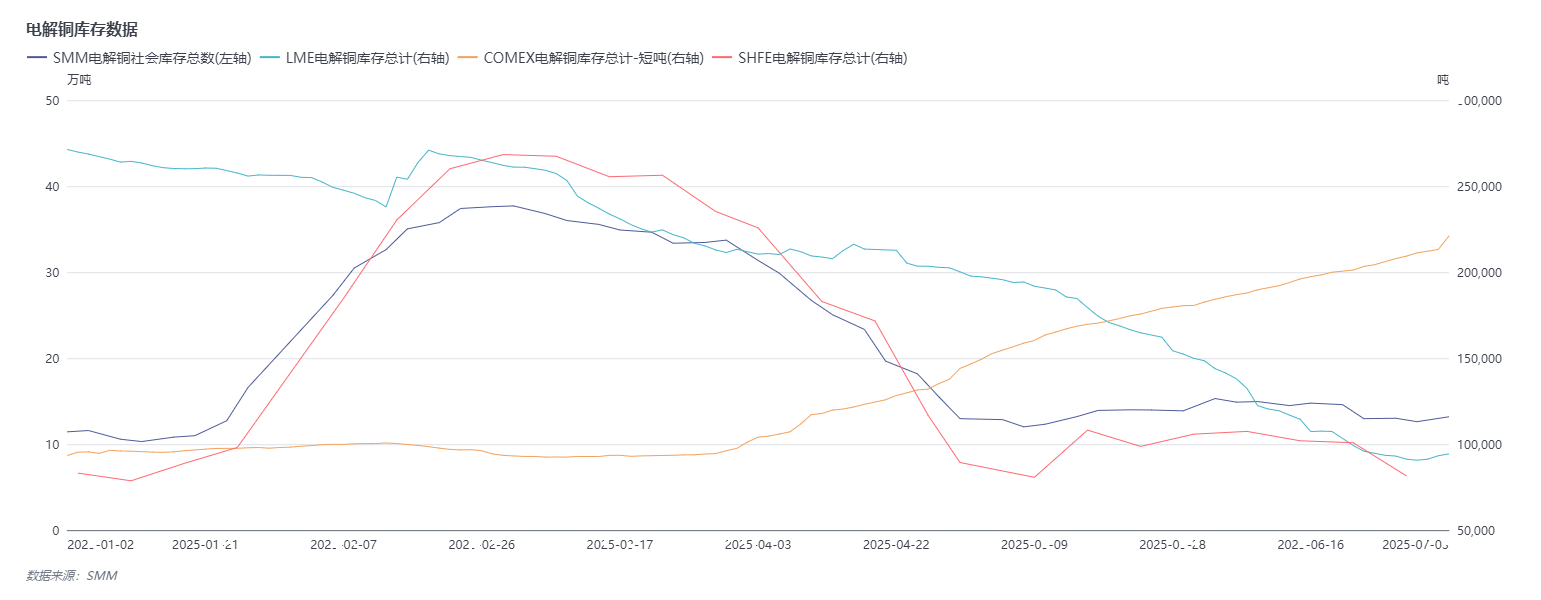
LME copper cathode inventories destocked by nearly 70%, while COMEX copper inventories surged
》Click to view SMM Metal Industry Chain Database
Inventory:From SMM's copper inventory data in major domestic regions, the inventory trend in the first half of 2025 showed certain fluctuations. Entering 2025, as of January 2 (Thursday), SMM's copper inventory in major domestic regions was 114,300 mt. Subsequently, the inventory showed an upward trend and reached a peak of 377,000 mt on March 3. However, after reaching this peak, the inventory entered an overall destocking phase. As of June 30 (Monday), the inventory dropped to 126,100 mt, an increase of 11,800 mt compared to the beginning of the year. It is worth noting that the current SMM copper inventory in major domestic regions is maintained near 130,000 mt, which is overall at a low level compared to the inventory level of around 400,000 mt in the same period last year. This low inventory level also reflects some changes in the supply-demand relationship in the copper market in the first half of the year. In contrast to the trend of domestic copper inventories, LME copper cathode inventories showed an overall destocking trend at the beginning of the year. After touching a low point of 103,100 mt on May 13, they began an overall upward trend in inventory, reaching a high point of 322,950 mt on August 29. Subsequently, they remained above 300,000 mt until early October, followed by a slight destocking trend. The LME inventory data on January 23, 2025, was 259,050 mt.
From the changes in LME copper cathode inventory data, the LME copper inventory on June 30 was 90,625 mt, a decrease of 180,725 mt compared to the inventory data of 271,350 mt on January 2, representing a decline of 66.6%.
From the COMEX copper inventories data: as of June 30, COMEX copper inventories stood at 211,209 short tons, representing a 117,837 short-ton (126.2%) increase compared to the 93,372 short tons recorded on January 2.
Market Outlook
►Macro Front
Domestically: Market expectations remain strong for favourable macro developments, with focus on policy signals from upcoming key meetings. Fiscal policy: In H2, the core focus lies in accelerated implementation of existing policies and timely rollout of incremental measures. With ultra-long special bonds and special-purpose bonds concentrated in Q3 issuance, fiscal expenditure will maintain intensity. Potential additional ultra-long special bond issuance may further support critical areas under the "program of large-scale equipment upgrades and consumer goods trade-ins" and "implement major national strategies and build up security capacity in key areas," while expanding trade-in policies to service consumption. New-type policy financial instruments may also be established to guide more social capital into infrastructure, technology, foreign trade, and consumption sectors, bolstering domestic growth. Monetary policy: Market consensus expects further LPR and reserve requirement ratio (RRR) cuts in H2. Capital market reforms are likely to deepen, attracting more medium and long-term funds. Consumption policies: After robust H1 measures, H2 may emphasize innovation in cultural tourism, sports, and health consumption scenarios, optimizing VAT refunds for overseas visitors to enhance convenience and multi-dimensional consumption potential. Fiscal support may also target livelihood areas like childbirth, employment, and service consumption to boost household medium and long-term spending willingness.
Internationally:US Fed policy:Strong June non-farm payrolls data extended the Fed's wait-and-see period, with markets nearly pricing out July interest rate cuts. Current pricing suggests ~70% probability for a September cut. Timely Fed action coupled with effective US economic support would buoy copper prices, while unexpected global downturn would suppress demand.Tariff policies:Implementation timing and rates of US Section 232 copper import tariffs become key variables. A 25% tariff pre-September may lift US Q3 inventories while reducing global stocks, with post-implementation US destocking likely reversing the trend in Q4, creating potential price dip-and-rebound. Delayed implementation could prolong imports into Q4, tightening ex-US markets and supporting prices. If no tariffs are ultimately imposed on copper, the high inventory levels in the US will suppress the price performance of COMEX copper, causing COMEX copper prices to fall below LME copper prices, leading to an overall decline in copper prices. Caution should be exercised regarding the potential disruptions to copper prices caused by fluctuations in US tariff policies.
Fundamentals side
Supply side: Looking ahead, the sources of incremental global copper concentrates are relatively limited, primarily relying on existing copper mine expansion projects. The number of newly commissioned world-class copper mine projects is small, and their contribution to incremental supply is also very limited, making it difficult to alleviate supply pressures. Moreover, large-scale developable copper mine projects are becoming increasingly scarce globally. As a result, the shortage of copper concentrates continues to intensify, and the undersupply situation in the short term is difficult to reverse. Given that market concerns about copper concentrate supply are unlikely to dissipate in the short term, it is expected that this will provide strong support for copper prices from the raw material end. Currently, there is a supply mismatch issue with copper cathode, with the US over-importing copper cathode in H1 and inventory levels in non-US regions being low. If this situation persists, it will support copper prices; if the supply mismatch issue is resolved due to factors such as the implementation of tariffs, the upside room for copper prices will be limited.
Demand side: Although power grid demand may remain strong, considering the pressure on home appliance exports brought about by tariffs, the impact of "anti-cut-throat competition" factors, and the expectation that global consumption growth will be lower than last year's projections, copper demand may experience marginal weakness in H2, which will have a certain inhibitory effect on copper prices.
Inventory side: Currently, domestic copper inventories and LME copper inventories are at relatively low levels, providing support for copper prices due to low inventory levels. It is worth noting that LME inventories are currently at historically low levels, making it highly susceptible to short squeezes, which will support copper prices. However, with changes in US tariff policies and adjustments in the global supply-demand relationship, inventory levels may change, thereby affecting copper prices. If US inventories continue to increase and are exported globally, it will alleviate the inventory tightness in non-US regions, and copper prices may be suppressed.
In summary, domestically, there is a strong expectation for increased domestic policy support, which is expected to provide a macroeconomic boost to copper prices. Overseas, whether the US Fed can cut interest rates as scheduled, market concerns about the Fed's independence, trade negotiations between the US and multiple countries, and the uncertainty of US tariffs may repeatedly disrupt copper prices. Fundamentals side, although overall copper demand growth in H2 may be flat or slightly contract, the support for copper prices from the supply-side shortage is stronger, enabling copper prices to remain strongly supported in H2.
Institutional voices
On July 3 (Thursday), a report released by UBS showed that it had raised its copper price forecasts for 2025 and 2026 by 7% and 4%, respectively, to $4.24 per pound and $4.68 per pound, reversing its previously more cautious demand outlook as the significant impact of tariff uncertainty had dissipated. Although tariff uncertainties may reduce end-user demand, UBS's base case scenario forecasts demand returning to trend levels within the next 12 months. Recoveries in traditional end-use markets like Europe and the US will support copper prices, with demand driven by restocking and long-term factors such as electrification, Germany's fiscal policy, defense, and AI sectors. Backed by favorable supply-side dynamics and long-term demand drivers, UBS maintains a fairly bullish outlook on copper prices.
Goldman Sachs anticipates upside risks for LME copper prices in August, forecasting $10,050/mt. The bank previously raised its 2025 H2 LME copper price forecast to an average of $9,890/mt (from $9,140/mt) and expects prices to pull back to $9,700/mt by December of this year, peaking at $10,050/mt in 2025. The 2026 average is projected at $10,000/mt (vs previous $10,170/mt forecast), with prices expected to reach $10,350/mt by December 2026.
Commerzbank forecasts copper prices to reach $9,500/mt by year-end.
CITIC Securities' research note states copper prices have fluctuated upward recently, with market divergence on future trends. From the commodity perspective, upstream copper concentrate production guidance and CAPEX remain extremely limited, while TC/RC fees continue to drop sharply - maintaining a tight balance in global refined copper supply. Additionally, China's "stable growth" and the US "soft landing" underpin copper price floors, with current market prices being relatively rational. Further upside would require stronger domestic macro policy support and stabilization in overseas economies, awaiting a new cycle. Elevated inflation expectations, interest rate cut expectations, and a slight pullback in the US dollar index could further support copper prices to hold up well. CITIC Securities maintains its H2 copper price forecast of $10,000-$11,000/mt, while cautioning against potential disruptions from July's "reciprocal tariff" developments.
Recommended Readings:
》Why Did China's H1 Copper Cathode Production Surge 674,700 mt? [[SMM Analysis]]